

Statistical Communiqué of China on 2017 National Economic and Social Development


STATISTICAL COMMUNIQUÉ OF
THE PEOPLE'S REPUBLIC OF CHINA
ON THE 2017 NATIONAL
ECONOMIC AND SOCIAL DEVELOPMENT
National Bureau of Statistics of China
February 28, 2018
In 2017, under the leadership of the Central Committee of the Communist Party of China with Comrade Xi Jinping as the core, all regions and departments have steadily strengthened their consciousness of the need to maintain political integrity, think in big-picture terms, uphold the leadership core and keep in alignment, implemented the spirit of the 18th National Congress of the Communist Party of China and the third, forth, fifth, sixth and seventh plenary sessions of the 18th Central Committee of Communist Party of China, studied and carried out the spirit of the 19th National Congress of the Communist Party of China and taken Xi Jinping Thought on Socialism with Chinese Characteristics for a New Era as the guideline. Following the arrangements of the Central Economic Working Conference and the Report on the Work of the Government, all regions and departments have adhered to the general working guideline of making progress while maintaining stability, stuck to the new development philosophy, taken the improvement of the quality and efficacy of development as the core, promoted balanced economic, political, cultural, social and ecological progress, coordinated the implementation of the four-pronged comprehensive strategy, focused on the supply-side structural reform and coordinated the efforts in stabilizing growth, stimulating reform, adjusting structure, benefiting people’s livelihood and fending off risks. As a result, the national economy has maintained the momentum of stable and sound development and exceeded the expectation and the economy and society are moving forward steadily and healthily.
I. General Outlook
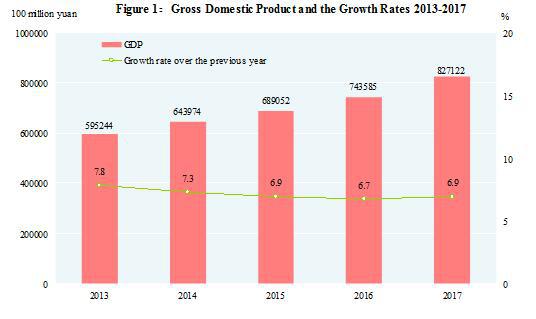
According to preliminary accounting, the gross domestic product (GDP)[2] in 2017 was 82,712.2 billion yuan, up by 6.9 percent over the previous year. Of this total, the value added of the primary industry was 6,546.8 billion yuan, up by 3.9 percent, that of the secondary industry was 33,462.3 billion yuan, up by 6.1 percent and that of the tertiary industry was 42,703.2 billion yuan, up by 8.0 percent. The value added of the primary industry accounted for 7.9 percent of the GDP; that of the secondary industry accounted for 40.5 percent; and that of the tertiary industry accounted for 51.6 percent. The contribution of the final consumption expenditure to GDP accounted for 58.8 percent, that of the gross capital formation 32.1 percent and that of the net exports of goods and services 9.1 percent. The per capita GDP in 2017 was 59,660 yuan, up by 6.3 percent compared with the previous year. The gross national income[3] in 2017 was 82,501.6 billion yuan, up by 7.0 percent over the previous year.

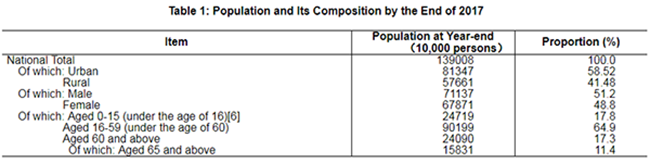
By the end of 2017, the total number of Chinese population at the mainland reached 1,390.08 million, an increase of 7.37 million over that at the end of 2016. Of this total, urban permanent residents numbered 813.47 million, accounting for 58.52 percent of the total population (the urbanization rate of permanent residents), and 1.17 percentage points higher than that at the end of last year. The urbanization rate of population with household registration was 42.35 percent, 1.15 percentage points higher than that at the end of 2016. The year 2017 saw 17.23 million births, a crude birth rate of 12.43 per thousand, and 9.86 million deaths, a crude death rate of 7.11 per thousand. The natural growth rate was 5.32 per thousand. The number of population who live in places other than their household registration areas[4] reached 291 million, of which 244 million were floating population[5].

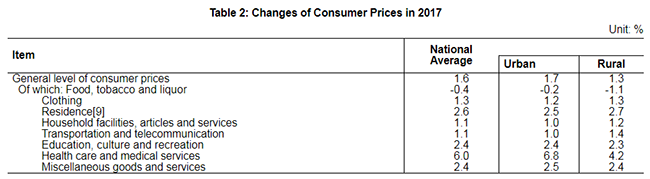
The consumer prices in 2017 went up by 1.6 percent over the previous year. The producer prices went up by 6.3 percent and the purchasing prices for manufactured goods up by 8.1 percent. The prices for investment in fixed assets increased by 5.8 percent. The producer prices for farm products[8] decreased by 3.5 percent.

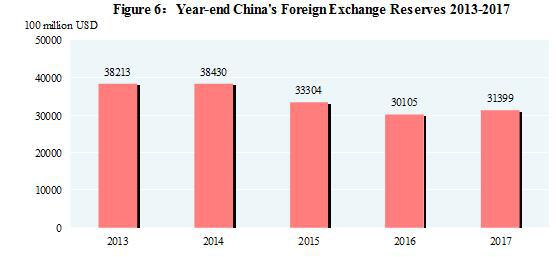
At the end of 2017, China’s foreign exchange reserves reached 3,139.9 billion US dollars, an increase of 129.4 billion US dollars as compared with that at the end of 2016. The average exchange rate of the year was 6.7518 RMB to 1 USD dollar, depreciated by 1.6 percent over that of 2016.
The supply-side structural reform was pushed forward solidly. In 2017, the national industrial capacity utilization rate[10] reached 77.0 percent, 3.7 percentage points higher than last year. Specifically, the capacity utilization rate for mining and washing of coal was 68.2 percent, 8.7 percentage points higher than last year and that for smelting and pressing of ferrous metals was 75.8 percent, 4.1 percentage points higher. At the end of 2017, the floor space of commercial buildings for sale was 589.23 million square meters, 106.16 million square meters less than that at the end of 2016. Specifically, the floor space of the commercial residential buildings for sale was 301.63 million square meters, 100.94 million square meters less. At the end of 2017, the asset-liability ratio of the industrial enterprises above the designated size was 55.5 percent, 0.6 percentage point less than that at the end of 2016. In 2017, the cost for per-hundred-yuan turnover of principal activities of the industrial enterprises above the designated size was 84.92 yuan, 0.25 yuan less compared with last year; the expense for per-hundred-yuan turnover of principal activities was 7.77 yuan, a decrease of 0.2 yuan. In 2017, the fixed assets investment in ecological protection and treatment of environmental pollution, public facilities management and agriculture (excluding by rural households) went up by 23.9 percent, 21.8 percent and 16.4 percent compared with last year.
The growth of new driving forces, new industries and new forms of businesses accelerated. In 2017, the value added of the industrial strategic emerging industries[11] above the designated size grew by 11.0 percent compared with last year. The value added of the high technology manufacturing industry[12] was up by 13.4 percent over the previous year, accounting for 12.7 percent of that of the industrial enterprises above the designated size. The value added for manufacture of equipment[13] was up by 11.3 percent, accounting for 32.7 percent of that of industrial enterprises above the designated size. In 2017, the production of new energy vehicles reached 0.69 million, up by 51.2 percent compared with last year; that of smart TV sets 96.66 million, up by 3.8 percent; that of industrial robots 0.13 million, up by 81.0 percent; that of civilian drones 2.90 million, up by 67.0 percent. Among the service enterprises above the designated size[14], the business revenue of the strategic emerging service industries[15] reached 4,123.5 billion yuan, up by 17.3 percent; the operating profit reached 744.6 billion yuan, up by 30.2 percent. In 2017, the investment in high technology industries[16] reached 4,291.2 billion yuan, an increase of 15.9 percent over last year, accounting for 6.8 percent of the investment in fixed assets (excluding by rural households); the investment in industrial technological transformation[17] was 10,591.2 billion yuan, up by 16.3 percent, accounting for 16.8 percent of the investment in fixed assets (excluding by rural households). The online retail sales[18] were 7,175.1 billion yuan in 2017, an increase of 32.2 percent compared with the previous year. The online retail sales of commodities were 5,480.6 billion yuan, an increase of 28.0 percent, accounting for 15.0 percent of the total retail sales of consumer goods. Among online retail sales of commodities, the sales of food increased by 28.6 percent, clothing by 20.3 percent and daily necessities by 30.8 percent. By the end of 2016, 25.1 percent of villages in China had set up e-commerce distribution sites.
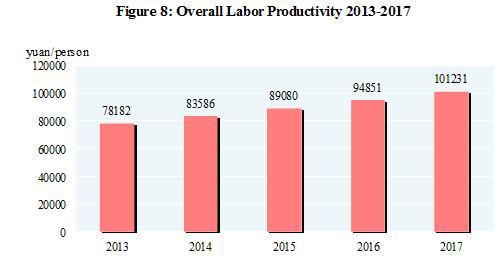
The quality and efficacy of development improved. The general public budget revenue reached 17,256.7 billion yuan in 2017, up by 7.4 percent over the previous year[19]. Of this total, the taxes collected in 2017 reached 14,436.0 billion yuan, an increase of 1,399.9 billion yuan or up by 10.7 percent. The profits made by the industrial enterprises above the designated size in 2017 were 7,518.7 billion yuan, an increase of 21.0 percent over the previous year. By ownership, the profits of state-holding enterprises were 1,665.1 billion yuan, up by 45.1 percent; those of collective enterprises 40.0 billion yuan, down by 8.5 percent; those of share-holding enterprises 5,240.4 billion yuan, up by 23.5 percent; those of the enterprises by foreign investors and investors from Hong Kong, Macao and Taiwan 1,875.3 billion yuan, up by 15.8 percent; and those of private enterprises 2,375.3 billion yuan, up by 11.7 percent. In terms of different sectors, the profit of mining was 458.7 billion yuan, an increase of 2.6 times compared with last year; those of manufacturing 6,651.1 billion yuan, up by 18.2 percent; those of the production and supply of electricity, heat power, gas and water 408.9 billion yuan, down by 10.7 percent. In 2017, the operating profit of service enterprises above the designated size reached 2,364.5 billion yuan, an increase of 24.5 percent. The overall labor productivity[20] was 101,231 yuan per person in 2017, an increase of 6.7 percent compared with that in 2016. In 2017,the qualification rate of manufactured products[21] reached 93.71 percent.
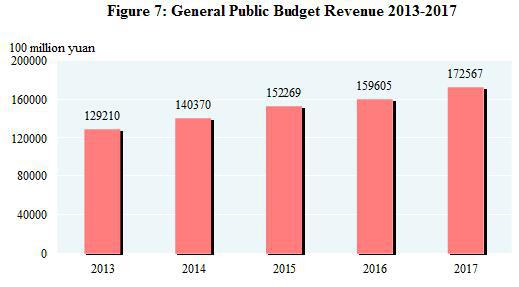
Note: Data for general public budget revenue from 2013 to 2016 as shown in the figure were final accounts, and that of 2017 was executive accounts.
II. Agriculture
In 2017, the sown area of grain was 112.22 million hectares, a drop of 0.81 million hectares compared with that in 2016. Of this total, the sown area of wheat was 23.99 million hectares, a decrease of 0.2 million hectares; the sown area of rice was 30.18 million hectares, a decrease of 2 thousand hectares; the sown area of corn was 35.45 million hectares, a decrease of 1.32 million hectares. The sown area of cotton was 3.23 million hectares, a decrease of 0.12 million hectares. The sown area of oil-bearing crops was 14.20 million hectares, an increase of 70 thousand hectares; the sown area of sugar crops was 1.68 million hectares, a decrease of 10 thousand hectares.
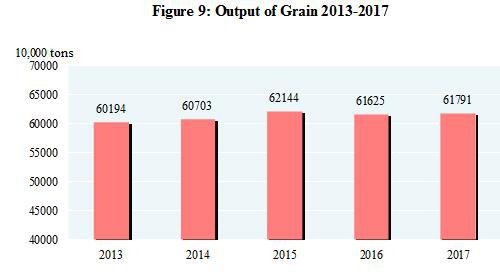
The total output of grain in 2017 was 617.91 million tons, an increase of 1.66 million tons or up by 0.3 percent over the previous year. Of this total, the output of summer crops was 140.31 million tons, up by 0.8 percent, and that of the early rice was 31.74 million tons, down by 3.2 percent over the previous year. The output of autumn grain was 445.85 million tons, up by 0.4 percent. The output of cereal was 564.55 million tons, a decrease of 0.1 percent, among which the output of rice was 208.56 million tons, up by 0.7 percent; that of wheat was 129.77 million tons, up by 0.7 percent; and that of corn was 215.89 million tons, down by 1.7 percent.
In 2017, the output of cotton was 5.49 million tons, an increase of 3.5 percent over the previous year, that of oil-bearing crops was 37.32 million tons, an increase of 2.8 percent, that of sugar crops was 125.56 million tons, an increase of 1.7 percent, and that of tea was 2.55 million tons, up by 6.0 percent.
The total output of pork, beef, mutton and poultry in 2017 reached 84.31 million tons, up by 0.8 percent over the previous year. Of this total, the output of pork was 53.40 million tons, up by 0.8 percent; that of beef was 7.26 million tons, up by 1.3 percent; that of mutton was 4.68 million tons, an increase of 1.8 percent; and that of poultry was 18.97 million tons, an increase of 0.5 percent. The total output of eggs was 30.70 million tons, down by 0.8 percent. The production of milk was 35.45 million tons, down by 1.6 percent. At the end of the year, 433.25 million pigs were registered in the total stocks, down by 0.4 percent, and 688.61 million pigs were slaughtered, up by 0.5 percent.
The total output of aquatic products in 2017 was 69.38 million tons, up by 0.5 percent over the previous year. Of this total, the output of cultured aquatic products was 52.81 million tons, up by 2.7 percent; and that of fished aquatic products was 16.56 million tons, down by 5.8 percent over the previous year.
The total production of timber for the year 2017 reached 76.82 million cubic meters, a decrease of 1.2 percent compared with the previous year.
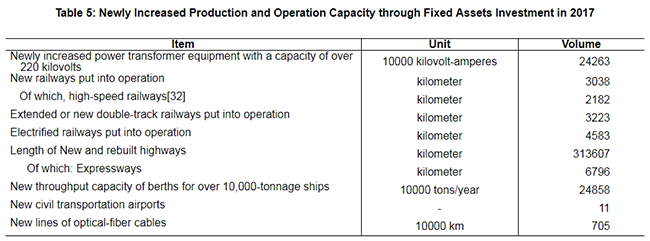
Over 1.09 million hectares of farmland were newly equipped with effective irrigation systems and another 1.44 million hectares of farmland was newly equipped with water-saving irrigation systems.
III. Industry and Construction
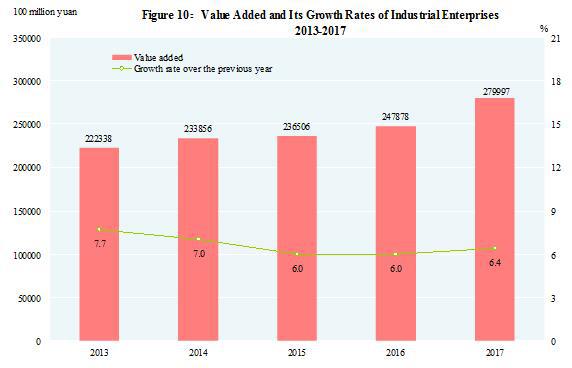
In 2017, the total value added of the industrial sector was 27,999.7 billion yuan, up by 6.4 percent over the previous year. The value added of industrial enterprises above the designated size increased by 6.6 percent. Of the industrial enterprises above the designated size, in terms of ownership, the value added of the state-holding enterprises grew by 6.5 percent, that of the collective enterprises up by 0.6 percent, that of the share-holding enterprises up by 6.6 percent, that of the enterprises by foreign investors and investors from Hong Kong, Macao and Taiwan up by 6.9 percent and that of private enterprises up by 5.9 percent. In terms of sectors, the value added of the mining industry was down by 1.5 percent, that of manufacturing up by 7.2 percent and that of production and supply of electricity, heat power, gas and water up by 8.1 percent.
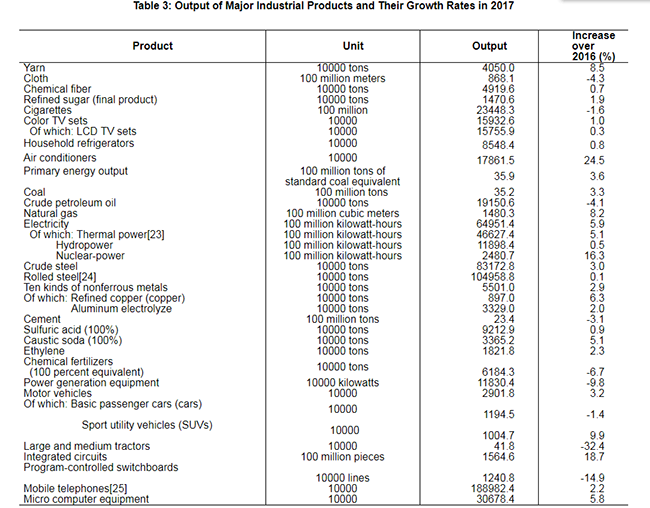
In 2017, of the industrial enterprises above the designated size, the value added for processing of food from agricultural and sideline products was up by 6.8 percent over the previous year; for textile industry up by 4.0 percent; for manufacture of raw chemical materials and chemical products up by 3.8 percent; for manufacture of non-metallic mineral products up by 3.7 percent; for smelting and pressing of ferrous metals up by 0.3 percent; for manufacture of general purpose machinery up by 10.5 percent; for manufacture of special purpose machinery up by 11.8 percent; for manufacture of automobiles up by 12.2 percent; for manufacture of electrical machinery and apparatus up by 10.6 percent; for manufacture of computers, communication equipment and other electronic equipment up by 13.8 percent; for production and supply of electricity and heat power up by 7.8 percent. The growth of the value added for the six major high energy consuming industries[22] was 3.0 percent, accounting for 29.7 percent of the value added of industrial enterprises above the designated size.
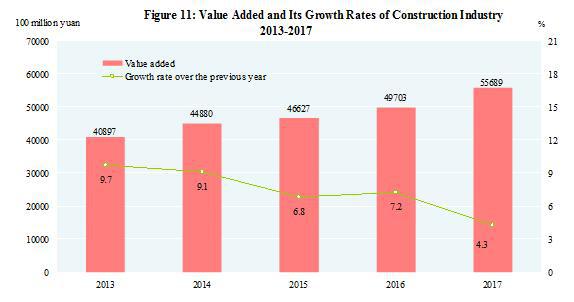
In 2017, the value added of construction enterprises in China was 5,568.9 billion yuan, up by 4.3 percent over the previous year. The profits made by construction enterprises qualified for general contracts and specialized contracts reached 766.1 billion yuan, up by 9.7 percent, of which the profits made by state-holding enterprises were 231.3 billion yuan, up by 15.1 percent.
IV. Investment in Fixed Assets
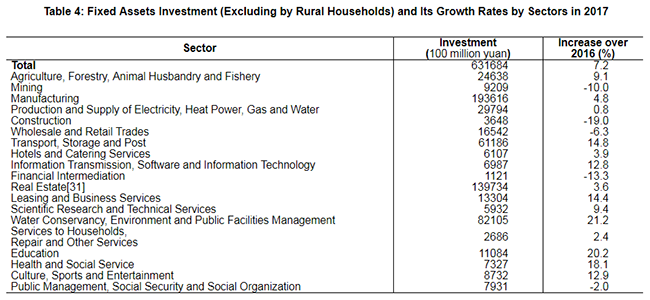
The total investment in fixed assets of the country in 2017 was 64,123.8 billion yuan, up by 7.0 percent over the previous year[27]. Of the total investment, the investment in fixed assets (excluding by rural households) was 63,168.4 billion yuan, up by 7.2 percent. By regions[28], the investment in eastern areas was 26,583.7 billion yuan, up by 8.3 percent over the previous year, in central areas 16,340.0 billion yuan, a growth of 6.9 percent, in western areas 16,657.1 billion yuan, a growth of 8.5 percent, and in northeastern areas 3,065.5 billion yuan, up by 2.8 percent.
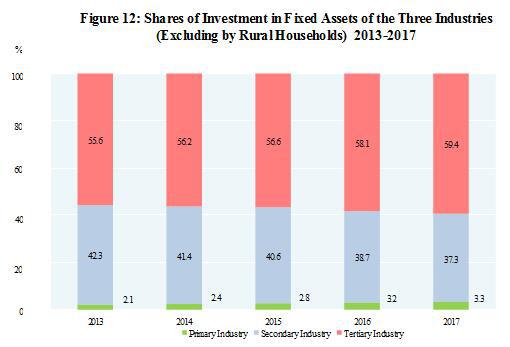
In the investment in fixed assets (excluding by rural households), the investment in the primary industry was 2,089.2 billion yuan, up by 11.8 percent; that in the secondary industry was 23,575.1 billion yuan, up by 3.2 percent; and that in the tertiary industry was 37,504.0 billion yuan, up by 9.5 percent. The investment in infrastructure[29] was 14,000.5 billion yuan, up by 19.0 percent, accounting for 22.2 percent of the investment in fixed assets (excluding by rural households). The private investment[30] in fixed assets was 38,151.0 billion yuan, an increase of 6.0 percent, accounting for 60.4 percent of the total investment in fixed assets (excluding by rural households). The investment in the six major high energy consuming industries was 6,443.0 billion yuan, down by 1.8 percent, accounting for 10.2 percent of the investment in fixed assets (excluding by rural households).
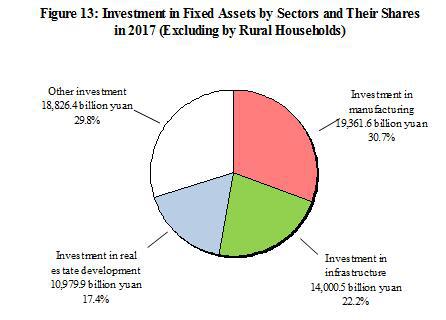
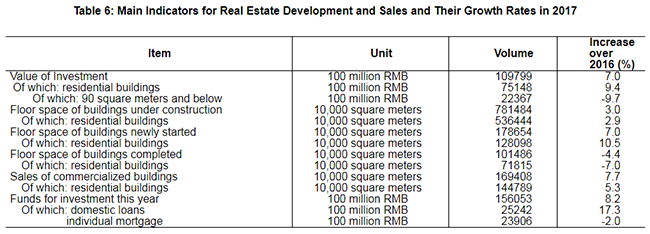
In 2017, the investment in real estate development was 10,979.9 billion yuan, up by 7.0 percent. Of this total, the investment in residential buildings reached 7,514.8 billion yuan, an increase of 9.4 percent, that in office buildings was 676.1 billion yuan, up by 3.5 percent, and that in buildings for commercial business was 1,564.0 billion yuan, down by 1.2 percent.
In 2017, 6.09 million housing units were started to be rebuilt in rundown urban areas nationwide. The number of housing units rebuilt in rundown areas was 6.04 million, that the number of public rental housing units built reached 0.82 million. In rural areas of China, among the poverty-stricken households that had their economic status registered at the local governments, 1.525 million[33] of them had witnessed their dilapidate houses rebuilt and renovated in 2017.
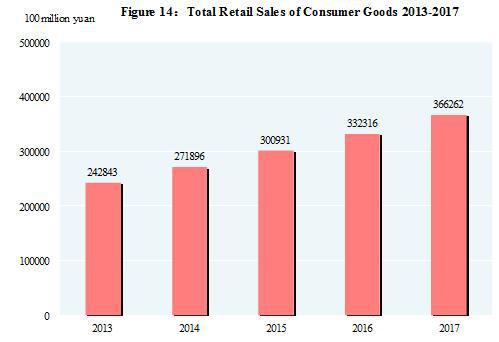
In 2017, the total retail sales of consumer goods reached 36,626.2 billion yuan, a growth of 10.2 percent over the previous year. An analysis on different areas showed that the retail sales of consumer goods in urban areas stood at 31,429.0 billion yuan, up by 10.0 percent, and that in rural areas reached 5,197.2 billion yuan, up by 11.8 percent. Grouped by consumption patterns, the retail sales of commodities was 32,661.8 billion yuan, up by 10.2 percent, and that of catering industry was 3,964.4 billion yuan, up by 10.7 percent.
Of the total retail sales of commodities by enterprises above the designated size, the year-on-year growth of sales for grain, oil, food, beverage, tobacco and liquor was up by 9.7 percent, for clothes, shoes, hats and textiles up by 7.8 percent, for cosmetics up by 13.5 percent, for gold, silver and jewelry up by 5.6 percent, for daily necessities up by 8.0 percent, for household appliances and audio-video equipments up by 9.3 percent, for traditional Chinese and western medicines up by 12.4 percent, for cultural and office appliances up by 9.8 percent, for furniture up by 12.8 percent, for telecommunication equipments up by 11.7 percent, for building and decoration materials up by 10.3 percent, for motor vehicles up by 5.6 percent, and for petroleum and petroleum products up by 9.2 percent,
VI. Foreign Economic Relations[34]
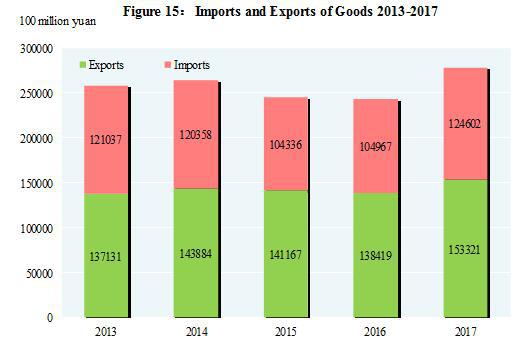
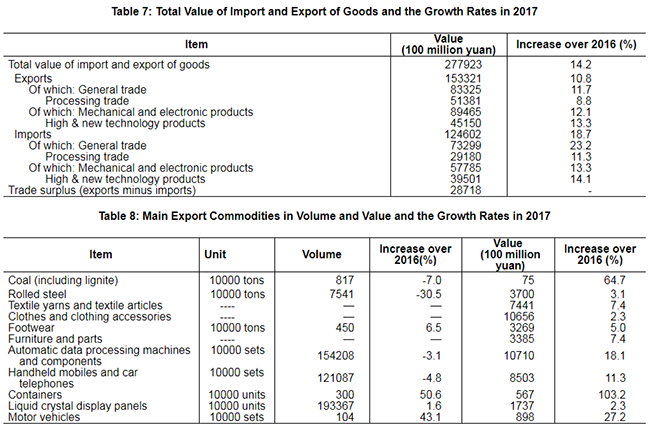
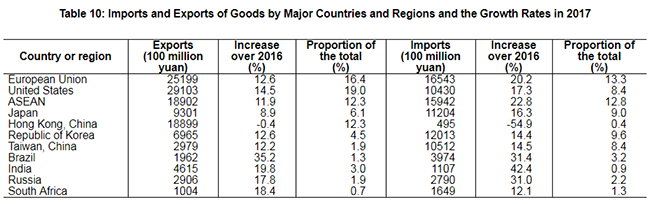
The total value of imports and exports of goods in 2017 reached 27,792.3 billion yuan, up by 14.2 percent over the previous year. Of this total, the value of goods exported was 15,332.1 billion yuan, up by 10.8 percent; the value of goods imported was 12,460.2 billion yuan, up by 18.7 percent. The balance of imports and exports (exports minus imports) was 2,871.8 billion yuan, a drop of 473.4 billion yuan over the previous year. The total value of goods imported from and exported to countries along the Belt and Road[35] was 7,374.5 billion yuan, an increase of 17.8 percent over the previous year. Of the total, the value of goods exported was 4,304.5 billion yuan, an increase of 12.1 percent; that of the import was 3,070.0 billion yuan, an increase of 26.8 percent.
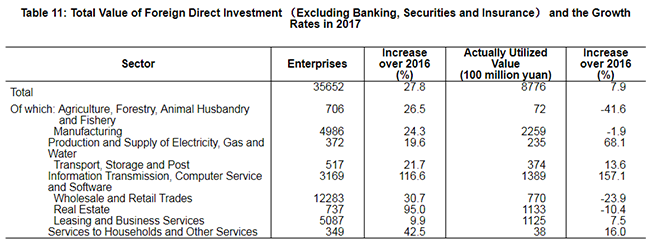
The year 2017 witnessed the establishment of 35,652 enterprises (excluding banking, securities and insurance) with foreign direct investment, up by 27.8 percent over the previous year; and the foreign direct investment actually utilized was 877.6 billion yuan (131.0 billion US dollars), up by 7.9 percent, 3.8 percentage points faster than last year. Specifically, there were 3,857 newly established enterprises receiving direct investment from countries along the Belt and Road, up by 32.8 percent; and the foreign capital directly invested in China was 37.4 billion yuan (5.6 billion US dollars). In 2017, the foreign investment actually utilized by high technology manufacturing industry reached 66.6 billion yuan, up by 11.3 percent.
VII. Transportation, Post, Telecommunications and Tourism
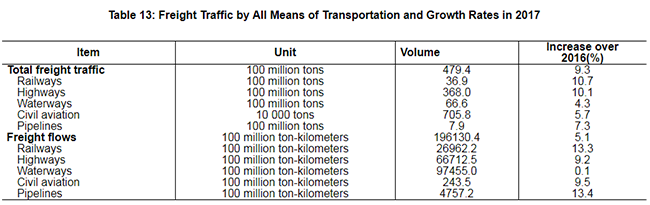
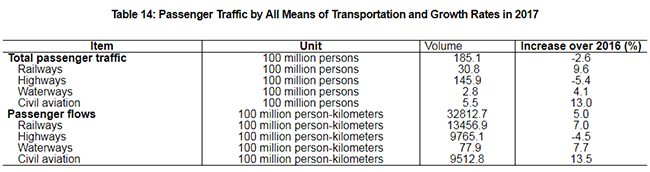
The total freight traffic reached 47.9 billion tons, up by 9.3 percent over 2016. The freight flows were 19,613.0 billion ton-kilometers, up by 5.1 percent. The volume of freight handled by ports above the designated size throughout the year totaled 12.6 billion tons, up 6.4 percent over the previous year, of which freight for foreign trade was 4.0 billion tons, up 5.7 percent. Container shipping of ports above the designated size reached 236.80 million standard containers, up by 8.3 percent.
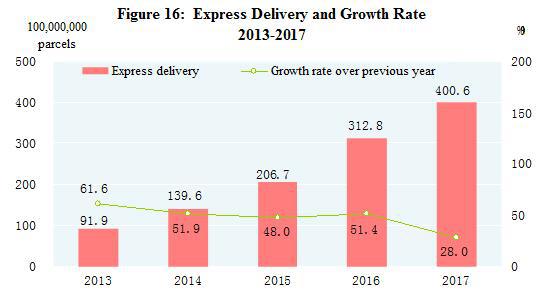
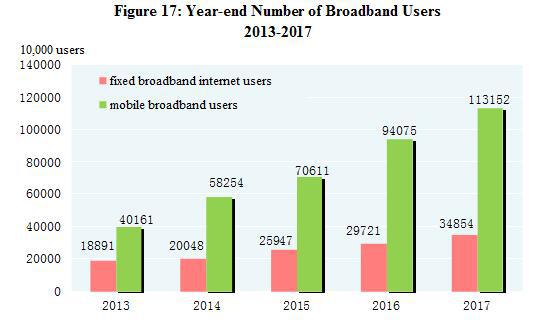
The turnover of post services[37] totaled 976.4 billion yuan, up 32.0 percent over the previous year. The number of mail delivery,parcel delivery and express delivery reached 3.15 billion, 30 million and 40.06 billion respectively. The revenue from express delivery reached 495.7 billion yuan. The turnover of telecommunication services[38] totaled 2,755.7 billion yuan, up 76.4 percent over the previous year. The newly increased capacity of mobile phone switchboard[39] was 236.46 million lines with the total capacity reaching 2,421.86 million lines. By the end of 2017, there were 1,611.25 million phone subscribers in China, of whom 1,417.49 million were mobile phone users. Mobile phone coverage rose to 102.5 sets per 100 persons. The number of fixed broadband internet users[40] reached 348.54 million, increased by 51.33 million over the previous year. Of this total, fixed fiber-optic broadband internet users[41] amounted to 293.92 million, an increase of 66.27 million. The number of mobile broadband users[42] was 1,131.52 million, an increase of 190.77 million. Mobile internet traffic was 24.6 billion G, up 162.7 percent over the previous year. The number of internet users was 772 million, grew by 40.74 million. Of the total, 753 million were mobile internet surfers[43], an increase of 57.34 million. The coverage of Internet was 55.8 percent nationwide and 35.4 percent in rural areas. Software revenue from software and IT services industry[44] totaled 5,503.7 billion yuan, up 13.9 percent.
The year 2017 registered 5.0 billion domestic tourists, up 12.8 percent over the previous year. The revenue from domestic tourism totaled 4,566.1 billion yuan, up 15.9 percent. The number of inbound visitors to China totaled 139.48 million, an increase of 0.8 percent. Of this total, 29.17 million were foreigners, up 3.6 percent; and 110.32 million were Chinese compatriots from Hong Kong, Macao and Taiwan, the same level as that of the previous year. Of all the inbound tourists, overnight visitors counted 60.74 million, an increase of 2.5 percent. Earnings from international tourism topped 123.4 billion US dollars, up 2.9 percent. The number of China’s outbound visitors totaled 142.73 million, up 5.6 percent. Of this total, 135.82 million were on private visits, an increase of 5.7 percent; and 86.98 million visited Hong Kong, Macao and Taiwan, up by 3.6 percent.
VIII. Financial Intermediation
By the end of 2017, money supply of broad sense (M2) was 167.7 trillion yuan, reflecting an increase of 8.2 percent. Money supply of narrow sense (M1) was 54.4 trillion yuan, up 11.8 percent. Cash in circulation (M0) was 7.1 trillion yuan, up 3.4 percent.
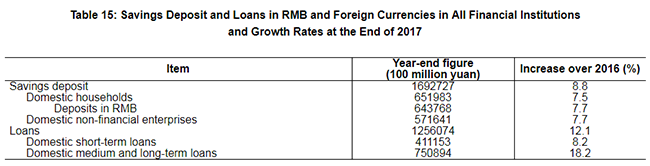
In 2017, the increment of social financing[45] reached 19.4 trillion yuan, or 1.6 trillion yuan more than that in 2016 on a comparable basis. The existing fund of social financing[46] totaled 174.6 trillion yuan at the end of 2017, up by 12.0 percent compared with that at the end of 2016. Savings deposit in Renminbi and foreign currencies in all items of financial institutions totaled 169.3 trillion yuan at the end of 2017, an increase of 13.7 trillion yuan compared with that at the beginning of the year. Of this total, the savings deposit in Renminbi stood at 164.1trillion yuan, an increase of 13.5 trillion yuan. Loans in Renminbi and foreign currencies in all items of financial institutions reached 125.6 trillion yuan, an increase of 13.6 trillion yuan. Of this total, loans in Renminbi were 120.1 trillion yuan, an increase of 13.5 trillion yuan.
Funds raised in 2017 by listed companies through domestic market amounted to 4,083.6 billion yuan, a decrease of 1,224.4 billion yuan from the previous year. Of this total, 419 A-shares completed subscription, raising 218.6 billion yuan worth of capital altogether. The refinancing of A-shares (including public newly issued, targeted placement, right issued, and preferred stock) raised 920.9 billion yuan worth of capital, a decrease of 417.8 billion yuan from 2016. The listed companies financed 2,810.5 billion yuan through issuing bonds (including corporate bonds, convertible bonds, exchangeable bonds and asset-backed securities) on Shanghai and Shenzhen Stock Exchanges, down by 856.3 billion yuan. In 2017, 2,176 companies were newly listed on National Equities Exchange and Quotations[47], raising 133.6 billion yuan, down by 3.95 percent.
In 2017, 5.64 trillion yuan corporate debenture bonds[48] were issued, a decrease of 2.59 trillion yuan over the previous year.
The premium[49] received by the insurance companies totaled 3,658.1 billion yuan in 2017, up 18.2 percent over the previous year. Of this total, life insurance premium amounted to 2,145.6 billion yuan, health and casualty insurance premium 529.1 billion yuan, and property insurance premium 983.5 billion yuan. Insurance companies paid an indemnity worth of 1,118.1 billion yuan, of which, life insurance indemnity was 457.5 billion yuan, health and casualty insurance indemnity 151.8 billion yuan, and property insurance indemnity 508.7 billion yuan.
IX. Households Income and Consumption and Social Security
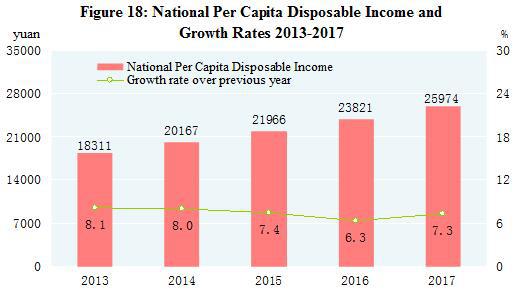
In 2017, the national per capita disposable income[50] was 25,974 yuan, an increase of 9.0 percent or a real increase of 7.3 percent after deducting price factors. The median[51] of national per capita disposable income was 22,408 yuan, up 7.3 percent. In terms of permanent residence, the per capita disposable income of urban households was 36,396 yuan, up by 8.3 percent, or a real growth of 6.5 percent after deducting price factors. The median of per capita disposable income of urban households was 33,834 yuan, up by 7.2 percent. The per capita disposable income of rural households was 13,432 yuan, up by 8.6 percent, or 7.3 percent in real terms. The median of per capita disposable income of rural households was 11,969 yuan, up by 7.4 percent. Grouped by income quintile[52], the per capita disposable income of low-income group reached 5,958 yuan, the lower-middle-income group 13,843 yuan, the middle-income group 22,495 yuan, the upper-middle-income group 34,547 yuan and the high-income group 64,934 yuan. The per capita monthly income of migrant workers was 3,485 yuan, increased by 6.4 percent.
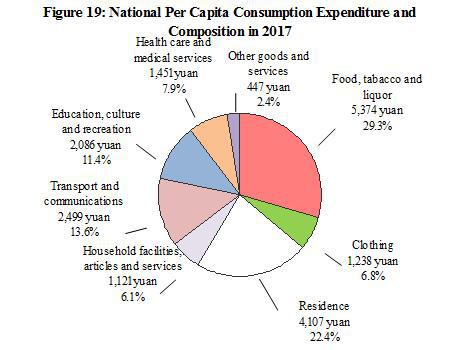
The national per capita consumption expenditure was 18,322 yuan, up by 7.1 percent, or a real growth of 5.4 percent after deducting price factors. In terms of permanent residence, the per capita consumption expenditure of urban households was 24,445 yuan, up by 5.9 percent, or 4.1 percent in real terms after deducting price factors. The per capita consumption expenditure of rural households was 10,955 yuan, up by 8.1 percent, or a real growth of 6.8 percent after deducting price factors. The Engel’s Coefficient was 29.3 percent, down by 0.8 percentage point over the previous year, with that of urban and rural households standing at 28.6 percent and 31.2 percent respectively.
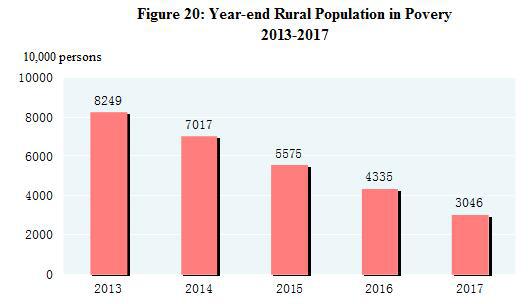
According to the rural poverty line of annual per capita income of 2,300 yuan (at 2010 constant prices), the population in poverty in rural areas numbered 30.46 million by the end of 2017, 12.89 million less[53] than that at the end of 2016. The incidence of poverty[54] was 3.1 percent, 1.4 percentage points lower than that in last year. The per capita disposable income of rural households in impoverished areas[55] was 9,377 yuan, up by 10.5 percent compared with 2016, or 9.1 percent in real terms.
By the end of 2017, a total of 401.99 million people participated in urban basic pension program for staff and workers, a year-on-year increase of 22.69 million. A total of 512.55 million people participated in basic pension insurance program for urban and rural residents, an increase of 4.08 million. A total of 1,176.64 million people participated in basic medical insurance program, an increase of 432.72 million. Of this total, 303.20 million people participated in basic medical insurance program for staff and workers, an increase of 7.89 million, and 873.43 million people participated in programs for urban and rural residents[56], an increase of 424.83 million. Some 187.84 million people participated in unemployment insurance programs, an increase of 6.95 million. The number of people receiving unemployment insurance payment stood at 2.20 million. A total of 227.26 million people participated in work accident insurance, an increase of 8.36 million. Of this total, 78.07 million were migrant workers, an increase of 2.97 million. A total of 192.40 million people participated in maternity insurance programs, an increase of 7.89 million. Minimum living allowances were granted to 12.64 million urban residents and 40.47 million rural residents, and 4.67 million rural residents living in extreme poverty[57] received relief and assistance. A total of 52.03 million people were financed to participate in basic medical insurance system and medical assistance was granted to 35.36 million cases. National subsidies and allowances were provided to 8.59 million entitled people.
X. Education, Science & Technology and Culture & Sports
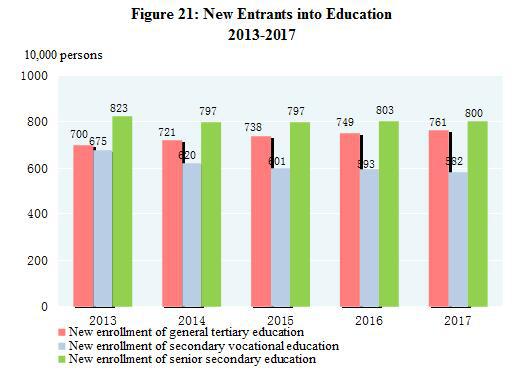
In 2017, the post-graduate education[58] enrollment was 2.639 million students with 805 thousand new students and 578 thousand graduates. The general tertiary education enrollment was 27.536 million students with 7.615 million new students and 7.358 million graduates. Vocational secondary schools[59] had 15.925 million enrolled students, including 5.824 million new entrants, and 4.969 million graduates. Senior secondary schools had 23.745 million enrolled students, including 8.001 million new entrants, and 7.757 million graduates. Students enrolled in junior secondary schools totaled 44.421 million, including 15.472 million new entrants, and 13.975 million graduates. The country had a primary education enrollment of 100.937 million students, including 17.666 million new entrants, and 15.659 million graduates. There were 579 thousand students enrolled in special education schools, with 111 thousand new entrants and 69 thousand graduates. Kindergartens accommodated 46.001 million children. The number of students graduating from compulsory education reached 93.8 percent of the total enrollment and the gross enrollment rate in senior high schools reached 88.3 percent.
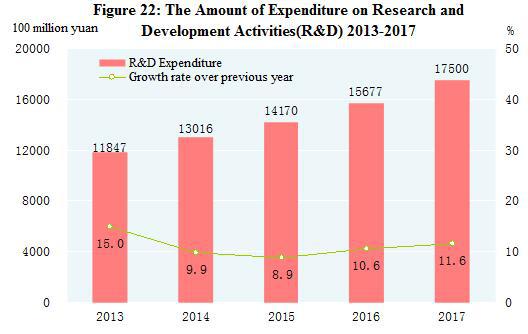
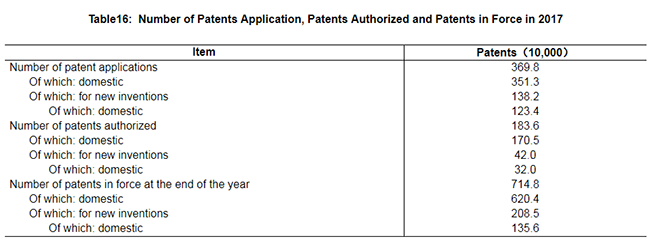
Expenditures on research and development activities (R&D) was worth of 1,750.0 billion yuan in 2017, up 11.6 percent over 2016, accounting for 2.12 percent of GDP. Of this total, 92.0 billion yuan was appropriated for fundamental research programs. 1,115 science and technology projects and 42 priority projects were arranged under the national key research and development program. A total number of 454 subjects were arranged under the national science and technology major projects and 43,935 projects were financed by the National Natural Science Foundation. By the end of 2017, there were altogether 503 state key laboratories, 131 national engineering research centers, 217 national engineering laboratories, and 1,276 national enterprise technical centers. The National Fund for Technology Transfer and Commercialization established 5 sub-funds, with the total size reaching 24.72 billion yuan. There were 3,698 thousand patent applications from home and abroad, and a total of 1,836 thousand were authorized. The number of PCT patent applications accepted[60] was 51 thousand. Till the end of year 2017, the number of patents in force was 7.148 million, of which 1,356 thousand were invention patents from home. The number of invention patents per 10,000 people was 9.8. A total of 368 thousand technology transfer contracts were signed, representing 1,342.4 billion yuan in value, up 17.7 percent over the previous year.
The year 2017 saw 17 times of successful satellite launches. The first high-orbit high throughput satellite Shijian 13 and first large hard X-ray space exploration satellite Insight were launched successfully. Two satellites in Beidou navigation satellite system were lifted off by one rocket for global networking. Tianzhou-1 Cargo Spacecraft was launched successfully and completed rendezvous and docking mission with Tiangong-2 Space Lab. The quantum satellite Mozi achieved the intended scientific goals. The Dark Matter Particle Explorer Wukong detected an anomaly in electrons. The large passenger aircraft C919 and the amphibious aircraft AG600, codenamed Kunlong made successful maiden flights.
By the end of 2017, there were altogether 35,000 laboratories for product inspection, including 739 national inspection centers. There were 401 agencies for product quality and management system certification, which accumulatively certified products in 140,250 enterprises. There were 4,037 authorized measurement institutions in the year, enforcing compulsory inspection on 83.26 million measurement instruments. A total of 3,811 national standards were developed or revised in the year, including 2,684 new standards.
At the end of 2017, there were 2,054 art-performing groups and 3,217 museums in the cultural system throughout China. A total of 3,162 public libraries received[61] 726.41 million people. There were 3,327 culture centers. Subscribers to cable television programs numbered 220 million, in which 198 million subscribed to digital cable television programs. Radio broadcasting and television broadcasting coverage rates were 98.7 percent and 99.1 percent respectively. A total of 13,310 episodes of 310 TV series and 83,599 minutes of TV cartoons were made in 2017. The country produced 798 feature movies and 172 science, educational, documentary, cartoon and special movies[62]. A total of 36.8 billion copies of newspapers and 2.6 billion copies of magazines were issued, and 9.0 billion copies of books were published. The average number of books possessed per person[63] was 6.49 copies. By the end of the year, there were 4,237 archives in China and 138.06 million documents were made accessible to the public. In 2016, the value added of culture and related industries totaled 3,078.5 billion yuan, up by 13.0 percent over the previous year, accounting for 4.14 percent of GDP, 0.19 percentage point higher than the previous year.
In 2017, Chinese athletes won 106 world championships on 24 sports events and broke 6 world records. Chinese physically-challenged athletes won 160 world championships in 11 international sports competitions. In 2016, the value added of sports industries totaled 647.5 billion yuan, up by 17.8 percent over the previous year, accounting for 0.9 percent of GDP, 0.1 percentage point higher than the previous year.
XI. Public Health and Social Services
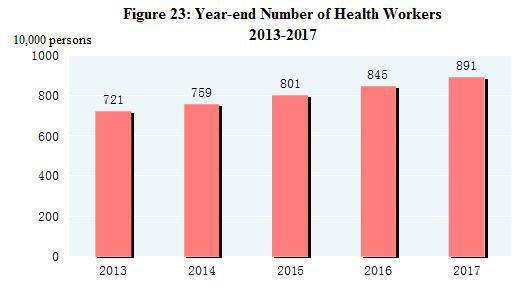
By the end of 2017, there were 995,000 medical and health institutions in China, including 30,000 hospitals. Of all the hospitals, 12,000 were public, and 18,000 were private. Of the 940,000 medical and health institutions at grass-root level, there were 37,000 township health centers, 35,000 community health service centers, 230,000 clinics and 638,000 village clinics. Of the 22,000 professional public health institutions, 3,482 were disease control and prevention centers and 3,133 were health monitoring institutions. There were 8.91 million health workers in China, including 3.35 million practicing doctors and assistant practicing doctors and 3.79 million registered nurses. The medical and health institutions in China possessed 7.85 million beds, of which, hospitals possessed 6.09 million and township health centers had 1.25 million. The total number of medical visits[64] and hospital discharges[65] in 2017 reached 8.10 billion and 240 million respectively.
By the end of 2017, there were altogether 32 thousand social welfare institutions providing accommodation, of which 29 thousand were elder-caring organizations and 656 were children caring organizations. The social welfare institutions provided 7.495 million beds[66], of which 7.142 million were for the elderly and 96 thousand were for children. There were 25 thousand community service centers and 139 thousand community service stations.
XII. Resources, Environment and Work Safety
In 2017, the total supply of state-owned land for construction use[67] was 600 thousand hectares, an increase of 16.4 percent over the previous year. Of this total, the supply for mining storage was 120 thousand hectares, up by 1.6 percent; that for real estate[68] was 115 thousand hectares, up by 7.2 percent; and that for infrastructure facilities was 365 thousand hectares, up by 26.1 percent.
The total stock of water resources in 2017 was 2,867.5 billion cubic meters. The annual average precipitation was 640 millimeters. At the end of 2017, the 604 large reservoirs covered by monitoring program in China stored 351.8 billion cubic meters of water, increased slightly over that at the end of last year. With an increase of 0.8 percent over 2016, the total water consumption reached 609.0 billion cubic meters, of which water consumption for living purposes rose by 2.8 percent, for industrial use grew by 0.2 percent, for agricultural use up by 0.6 percent, and for ecological water supplement grew by 1.7 percent. Water consumption for every 10 thousand yuan worth of GDP produced[69] was 78 cubic meters, a decline of 5.6 percent over the previous year. Water consumption for every 10 thousand yuan worth of industrial value added was 49 cubic meters, down by 5.9 percent. Per capita water consumption was 439 cubic meters, up by 0.3 percent.
In 2017, a total of 7.36 million hectares of forests were planted, of which 3.90 million hectares were afforested by manpower, accounting for 53.0 percent of the total. Forest tending areas reached 8.30 million hectares. By the end of 2017, there were 2,750 natural reserves including 463 national ones. A total of 56 thousand square kilometers of eroded land was put under treatment programs.
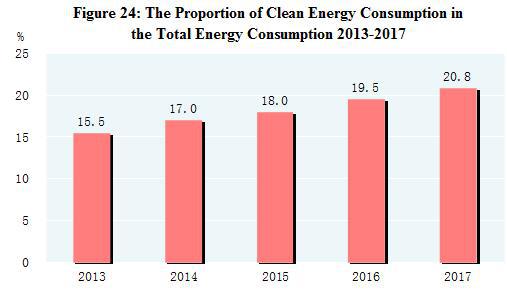
Preliminary estimation indicated that the total energy consumption in 2017 amounted to 4.49 billion tons of standard coal equivalent, up 2.9 percent over 2016. The consumption of coal increased by 0.4 percent; crude oil, up 5.2 percent; natural gas, up 14.8 percent; and electric power, up 6.6 percent. The consumption of coal accounted for 60.4 percent of the total energy consumption, down 1.6 percentage points over 2016, while clean energy consumption, such as natural gas, hydropower, nuclear power and wind power accounted for 20.8 percent, up 1.3 percentage points. The national energy consumption per 10,000 yuan worth of GDP went down by 3.7 percent. The comprehensive energy consumption per unit caustic soda of key energy-intensive industrial enterprises went down by 0.3 percent, that of per ton cement dropped by 0.1 percent, per ton steel, declined by 0.9 percent, and per ton crude copper, down by 4.8 percent. The standard coal consumption per kilowatt-hour of thermal power generation was decreased by 0.8 percent. The carbon dioxide emission per 10,000 yuan worth of GDP was cut by 5.1 percent.
Monitoring of oceanic water quality at 417 offshore monitoring stations indicated that oceanic water met the national quality standard Grade I and II in 67.8 percent of the stations; water quality at 10.1 percent of the stations met Grade III standard; and water of Grade IV or inferior quality was found at 22.1 percent of the stations.
Of the monitored 338 cities at prefecture level and above, 29.3 percent reached the air standard and 70.7 percent failed. The annual average concentration of particulate matter (PM2.5) for cities (based on 262 cities failed to reach the standard of annual average concentration in 2015) that failed to meet the standard stood at 48 micrograms per cubic meter, down by 5.9 percent over the previous year.
Of the 323 cities subject to noise monitoring program, 5.9 percent enjoyed fairly good environment, 65.0 percent had good environment, 27.9 percent had fair environment, 0.9 percent had poor environment and 0.3 percent had very poor environment in downtown areas.
The average temperature in 2017 was 10.39℃, up by 0.03℃ compared with that of the previous year. Typhoon hit China 8 times in 2017.
In 2017, natural disasters hit 18.48 million hectares of crops, of which 1.83 million hectares of crops were demolished. Flood, waterlog and geological disasters caused a direct economic loss of 191.0 billion yuan. Drought caused a direct economic loss of 37.5 billion yuan. Disasters from low temperature, frost and snow made a total direct economic loss of 1.9 billion yuan. Oceanic disasters caused a direct economic loss of 5.8 billion yuan. The country recorded 13 earthquakes with magnitude 5 and over, 11 of which caused disasters, causing a direct economic loss of 14.8 billion yuan. The year 2017 witnessed 3,223 forest fires, with 25 thousand hectares of forests damaged.
The death toll due to work accidents amounted to 37,852 people. Work accidents in industrial, mining and commercial enterprises caused 1.639 deaths out of every 100 thousand employees, down by 3.7 percent over 2016. The road traffic death toll per 10 thousand vehicles was 2.06 persons, down by 3.7 percent. The death toll for one million tons of coal produced in coalmines was 0.106 person, down 32.1 percent.
In case of any differences between English translation and the original Chinese text, the Chinese edition shall prevail.
Note:
1. All figures in this Communiqué are preliminary statistics. Statistics in this Communiqué do not include Hong Kong SAR, Macao SAR and Taiwan Province. Due to the rounding-off reasons, the subentries may not add up to the aggregate totals.
2. Gross domestic product (GDP), value added and per capita GDP as quoted in this Communiqué are calculated at current prices whereas their growth rates are at constant prices.
3. Gross national income, also known as gross national product, refers to the total primary distribution of the income created by all the resident units of a country (or a region) during a certain period of time. It equals to gross domestic product plus the net primary distribution of income from abroad.
4. Population who live in places other than their household registration areas refers to those who reside in areas other than their household registration and have been away from there for over 6 months.
5. Floating population refers to the population who live in places other than their household registration excluding those with current residences different from the places of their household registration but still in the same city. Population who live in places other than their household registration but still in the same city refers to those whose current residences are different from the registered towns or streets in the same district or in different districts but still in the same municipality or prefecture-level city.
6. By the end of 2017, the population aged 0 to 14 (under the age of 15) was 233.48 million and that aged 15 to 59 (under the age of 60) was 915.70 million.
7. The number of migrant workers includes those who are employed outside their villages and towns for more than six months in the year and those who do non-agricultural work in their villages and towns for more than six months in the year.
8. The producer prices for farm products refer to the prices of farm products sold directly by producers.
9. The prices for residence include prices for rent, maintenance and management, water, electricity and fuel etc.
10. Capacity utilization rate refers to the ratio of the actual production to the production capacity (in terms of value). Actual production refers to the total industrial output value during the enterprise’s reporting period. Production capacity refers to the production which can be realized and sustained for a long term under the condition of the supply of labor force, materials, fuel and transportation guaranteed and the production equipment in proper operation.
11. Industrial strategic emerging industries refer to the related industrial sectors of energy-saving and environmental protection, information technology of new generation, biotech, manufacture of high-end equipment, new energy, new materials, and new energy cars.
12. High technology manufacturing industry includes manufacture of medicine, manufacture of aerospace vehicle and equipment, manufacture of electronic and communication equipment, manufacture of computers and office equipment, manufacture of medical equipment, manufacture of measuring instrument and equipment and manufacture of optical and photographic equipment.
13. Manufacture of equipment includes manufacture of metal products, general purpose equipment, special purpose equipment, automobiles, railway, ship, aerospace and other transport equipment, electrical machinery and apparatus, computers, communication and other electric equipment and measuring instrument and machinery.
14. Service enterprises above the designated size refer to legal entities of transport, storage and post, information transmission, software and information technology services, real estate (excluding real estate development and operation), leasing and business services, scientific research and technical services, water conservancy, environment and public facilities management, education, health and social work with annual business revenue of 10 million yuan and above or with 50 employees and above at the end of the year; legal entities of services to households, repair and other services and culture, sports and entertainment with annual business revenue of 5 million and above or with 50 employees and above at the end of the year.
15. Strategic emerging service industries refer to the related service sectors of energy-saving and environmental protection, information technology of new generation, biotech, manufacture of high-end equipment, new energy, new materials, and new energy cars.
16. Investment in high technology industries refers to investment in six high technology manufacturing industries, including the manufacture of medicine and manufacture of aerospace vehicle and equipment, and nine high technology service industries, including information service and e-commerce service.
17. Investment in industrial technological transformation refers to the investment in the improvement of the existing equipments, technologies and production services through new technologies, crafts, equipments and materials so as to achieve intensive development.
18. Online retail sales refer to the retail sales of goods and services realized through internet trading platforms (online platforms mainly in trading physical commodities, including self-built websites and third-party platforms). The sales of services of online retail and a few other goods for production operation and resale are not covered by the total retail sales of consumer goods.
19. To facilitate the coordinated use of financial funds, starting from January 1, 2017, 3 items under the government budget funds including land use fee for additional construction land, fund for South-to-North Water Diversion Project and special payment from tobacco enterprises were reallocated under the general public budget. To this end, the base of the year 2016 has taken the effect of the reallocation of the 3 items into consideration, based on which the year-on-year changes both in volume and in growth rate were calculated.
20. The overall labor productivity refers to the ratio between the GDP (at 2015 constant price) and the total number of persons employed.
21. Qualification rate of manufactured products is the ratio of the samples that have passed the sampling quality test, the process of which follows certain methods, procedure and standard, to the total amount of the sampled products. The survey samples cover 29 sectors of the manufacturing industry.
22. The six major high energy consuming industries consist of processing of petroleum, coking and processing of nuclear fuel, manufacture of raw chemical materials and chemical products, manufacture of non-metallic mineral products, smelting and pressing of ferrous metals, smelting and pressing of non-ferrous metals and production and supply of electricity and heat power.
23. Thermal power refers to electricity generated by coal, oil, gas, residual heat, pressure and gas, waste incineration and biomass.
24. The data include 240.00 million tons of steel which has been reprocessed among enterprises.
25. The data of mobile telephones and the production of steel in 2016 were adjusted according to special surveys. The growth rates of production in 2017 were calculated on a comparable basis.
26. Some installed power generation capacity was not listed (e.g. geothermal).
27. The base of the investment in fixed assets in 2016 was adjusted according to results of the third agricultural census and the growth rates in 2017 were calculated on a comparable basis.
28. The national total investment in fixed assets (excluding by rural households) was larger than the aggregate of the subtotals of fixed assets investment in the eastern areas, central areas, western areas and northeastern areas due to the fact that some of the trans-regional investments are not covered by regional figures. The eastern areas include 10 provinces and municipalities: Beijing, Tianjin, Hebei, Shanghai, Jiangsu, Zhejiang, Fujian, Shandong, Guangdong and Hainan; the central areas cover 6 provinces: Shanxi, Anhui, Jiangxi, Henan, Hubei and Hunan; the western areas include 12 provinces, autonomous regions and municipalities: Inner Mongolia, Guangxi, Chongqing, Sichuan, Guizhou, Yunnan, Tibet, Shaanxi, Gansu, Qinghai, Ningxia and Xinjiang; the northeastern areas include 3 provinces: Liaoning, Jilin and Heilongjiang.
29. Investment in infrastructure refers to the investment in the construction or purchase of fundamental, public-serving projects and facilities for the social production and people’s life, including transportation, postal service, telecommunication, radio, TV and satellite transmission, internet and related services, water conservancy, environment and public facilities management.
30. Private investment in fixed assets refers to investment in the construction or purchase of fixed assets by domestic collective, private and individual-owned enterprises or organizations or their holding enterprises (with absolute holding and relative holding enterprises).
31. The investment in real estate includes the investment in real estate development, construction of buildings for own use, property management, intermediary services and other real estate investment.
32. High-speed railways refer to railways with a maximum operating speed of 200 km/h and above and railways with a maximum operating speed less than 200 km/h but only for high speed trains.
33. It refers to the number of dilapidated houses rebuilt belonging to the poverty-stricken households that had their economic status registered at the local governments by the end of December 2017 which was reported by all provinces (autonomous regions and municipalities).
34. Imports and exports of goods and services and foreign investment absorbed are calculated in RMB. Overseas investment and contracted overseas engineering projects are still in US dollar due to technical reasons.
35. The Belt and Road refers to the Silk Road Economic Belt and the 21st Century Maritime Silk Road.
36. The imports and exports of services are calculated according to the sixth edition of Balance of Payments and International Investment Position Manual (BPM6), and the growth rate is calculated on a comparable basis.
37. The turnover of post services is calculated at constant prices of 2010.
38. The turnover of telecommunication services is calculated at constant prices of 2015.
39. The capacity of mobile phone switchboard refers to the number of maximum concurrent users calculated by mobile phone switchboard according to selected calling models and switchboard processing capacity.
40. Fixed broadband internet users refer to those who make registration in the telecommunication enterprises and access the Internet through xDSL, FTTx+LAN, FTTH/0 and other broadband access ways as well as dedicated lines at the end of the reporting period.
41. Fixed fiber-optic broadband internet users refer to those who make registration in the telecommunication enterprises and access the Internet through FTTH or FTT0 at the end of the reporting period.
42. Mobile broadband users refer to those who have records in the billing system and use 3G or 4G network resources at the end of the reporting period.
43. The number of mobile Internet surfer refers to the number of Chinese residents aged 6 and above who connected to and surfed on the Internet via mobile phones in the past six months.
44. Software and IT services industry includes software development, information system integration, IT consulting service, data processing and storage, integrated circuit design and other IT services industry.
45. The increment of social financing refers to the total funds raised by real economy (domestic non-financial enterprises and individuals) from the financial system over a period of time.
46. The existing fund of social financing refers to the balance of the capital raised by real economy (domestic non-financial enterprises and individuals) from the financial system at the end of a certain period of time (a month, a quarter or a year).
47. National Equities Exchange and Quotations, also called “the New Over-the-Counter Market”, is a national securities exchange established upon approval by the State Council in 2012.
48. Corporate debenture bonds include debt financing instruments of non-financial businesses, enterprise bonds, corporate bonds and convertible bonds.
49. The original premium income received by the insurance companies refers to the premium income from original insurance contracts confirmed by the insurance companies.
50. The reason why the nominal growth rate of national income outpaces that in urban and rural areas is that, in urbanization process, some higher income population in rural areas move to cities and fall into lower income group in urban areas. Their migration lowers the income of urban and rural households. However, the effect of income growth, whether in rural or urban areas, is reflected in the national income growth.
51. The median of per capita income refers to the per capita income of household lied in the middle of all surveyed households which are ranked from low to high (or high to low) based on per capita income level.
52. The income quintile refers to the five equal partitions of all surveyed households, who are ranked from low to high based on per capita income level. The top 20 percent with the highest income are classified as high-income group, and the other four levels are upper-middle-income group, middle-income group, lower-middle-income group and low-income group.
53. The number of people lifted out of poverty equals the population in poverty in the current year minus that in the previous year. It is also equivalent to the population out of poverty minus the population returning to poverty in the current year.
54. The incidence of poverty refers to the proportion of population in poverty to targeted population under survey.
55. Impoverished areas cover contiguous poverty-stricken areas and key counties under national poverty alleviation and development program beyond those areas. There were 832 counties altogether. Since 2017, Aksu prefecture in Xinjiang has also been covered in poverty monitoring.
56. The recipients of basic medical insurance for urban and rural residents increased remarkably because the recipients of new type of rural cooperative medical care are now incorporated in the statistics of basic medical insurance for urban and rural residents and the coverage of basic medical insurance is further expanded with the launch of full registration for universal participation in social insurance.
57. Rural residents living in extreme poverty refer to the aged, the disabled and the minor under 16 years of age in rural areas who have no ability to work, no sources of income and no statutory obligors to provide for them, bring them up or support them, or whose statutory obligors have no ability to fulfill their obligations.
58. In 2017, the coverage of new post-graduate students and post-graduate enrollment has changed (part-time post-graduate students were added).
59. Vocational secondary schools include regular specialized secondary schools, adult specialized secondary schools, vocational high schools and skilled workers schools.
60. The number of PCT patent applications accepted refers to the number of PCT patent application accepted by the State Intellectual Property Office which acts as the receiving office of PCT patent application. PCT is the abbreviation of Patent Cooperation Treaty, which is a treaty for international cooperation in the field of patents.
61. The people received by the public libraries refer to the number of people who visit libraries and use library services in the year, including borrowing and reading books, consultation and attending readers’ programs.
62. Special movies refers to those using different display modes in terms of projection techniques, equipment and program as compared with the ordinary cinemas, such as IMAX movies, 3D movies, 4D movies, multidimensional movies and full dome movies.
63. The average number of books possessed per person refers to the average number of books published in the year that can be possessed per person in China.
64. The total number of medical visits refers to the number of people receiving medical services, including outpatient services, emergency treatment, home visits, appointment-based treatment, health check-up of a specific item, and health counseling and guidance (excluding health lectures).
65. The number of hospital discharges refers to the number of inpatients released from hospitals in the reporting period, including those who are discharged from hospitals or transferred to other medical institutions following doctors’ advice, discharged from hospitals without doctors’ permission, dead or other situations. The number of people who are recovered from family sickbeds is excluded.
66. The beds provided by social welfare institutions include those provided by adoption agencies, aid agencies, community agencies, serviceman recreation habitation and military supply stations etc.
67. Total supply of state-owned land for construction use refers to the supply of state-owned land for construction use with the land-used right sold, allocated or leased to units or individuals by the municipal or county governments according to annual land supply plan and in line with relevant laws in the reporting period.
68. Land used for real estate refers to the sum of land used for commercial service and for residence.
69. The consumption of water and energy for producing 10 thousand yuan worth of GDP and water consumption for every 10 thousand yuan worth of industrial value added are calculated at 2015 constant prices.
Data Sources:
In this Communiqué, data of urbanization rate of population with household registration, motor vehicles for civilian use and the traffic accidents are from the Ministry of Public Security; data of newly increased employed people, registered unemployment rate, social security and skilled workers schools are from the Ministry of Human Resources and Social Security; data of foreign exchange reserves and exchange rate are from State Administration of Foreign Exchange; financial data are from the Ministry of Finance; data of qualification rate of manufactured products, quality test and national standard formulation and revision are from General Administration of Quality Supervision, Inspection and Quarantine; data of output of aquatic products are from the Ministry of Agriculture; data of production of timber, forestry and forest fires are from the State Forestry Administration; data of areas with effective irrigation system, water resources and soil erosion are from the Ministry of Water Resources; data of installed power generation capacity and newly increased power transformer equipment with a capacity of over 220 kilovolts are from China Electricity Council; data of new railways put into operation, new double-track railways put into operation, electrified railways put into operation and railway transportation are from China Railway; data of new and rebuilt highways, new throughput capacity of berths for over 10000-tonnage ships, highway transportation, waterway transportation and volume of freight handled by ports are from the Ministry of Transport; data of new civil transportation airports and civil aviation are from the General Administration of Civil Aviation; data of new lines of optical-fiber cables, business volume of telecommunication service, capacity of phone switchboards, phone users, broadband users, mobile internet traffic, internet users, the coverage of internet and software revenue are from the Ministry of Industry and Information Technology; data of housing units rebuilt in rundown areas, public rental housing and dilapidated houses rebuilt belonging to poor rural households that had their economic status registered at local governments are from the Ministry of Housing and Urban-Rural Development; data of imports and exports of goods are from the General Administration of Customs; data of imports and exports of services, foreign direct investment, overseas direct investment, overseas contracted projects and overseas labor contracts are from the Ministry of Commerce; data of pipelines are from China National Petroleum Corporation, China Petrochemical Corporation and China National Offshore Oil Corporation; data of post services are from the State Post Bureau; data of the internet coverage of rural areas are from China Internet Network Information Center; data of tourism are from the National Tourism Administration and the Ministry of Public Security; data of monetary finance and corporate debenture bonds are from the People’s Bank of China; data of listed companies are from the China Securities Regulatory Commission; data of insurances are from China Insurance Regulatory Commission; data of urban and rural minimum living allowances, relief and assistance granted to rural residents living in extreme poverty, social services, areas of crops hit by natural disasters, direct economic loss caused by flood, waterlog and geological disaster, direct economic loss caused by drought, direct economic loss caused by low temperature, frost and snow are from the Ministry of Civil Affairs; data of education are from the Ministry of Education; data of national key research and development programs, national science and technology major projects, state key laboratories, national fund for technology transfer and commercialization and technology transfer contracts are from the Ministry of Science and Technology; data of natural science foundation projects are from the National Natural Science Foundation, data of national engineering research centers, national engineering laboratories, enterprise technical centers and carbon dioxide emission per 10,000 yuan worth of GDP are from the National Development and Reform Commission; data of patents are from the State Intellectual Property Office; data of satellite launch are from the State Administration of Science, Technology and Industry for National Defense; data of art-performing groups, museums, public libraries and culture centers are from the Ministry of Culture; data of radio, television, movies, newspapers, magazines and books are from the State Administration of Press, Publication, Radio, Film and Television; data of documents are from the State Archives Administration; data of sports are from the General Administration of Sport; data of physically-challenged athletes are from the China Disabled Persons’ Federation; data of health are from the National Health and Family Planning Commission; data of supply of state-owned land for construction use are from the Ministry of Land and Resources; data of natural reserves and environment monitoring are from the Ministry of Environmental Protection; data of average temperature and typhoon are from the China Meteorological Administration; data of direct economic loss caused by oceanic disasters are from the State Oceanic Administration; data of the number of earthquakes and direct economic loss caused by earthquakes are from the China Earthquake Administration; data of work safety are from the State Administration of Work Safety; all the other data are from the National Bureau of Statistics.